The customer journey is an essential aspect of any business, big or small. It represents a customer’s entire experience, also called a “customer journey map“, from the moment they first become aware of your brand to the point where they make a purchase and beyond.
For small business owners, understanding and optimizing the customer journey is crucial for driving growth, enhancing customer satisfaction, and fostering long-term loyalty.
One of the most effective ways to improve the customer journey is by tracking specific metrics that reveal how well your business performs at each stage.
These key performance indicators (KPIs) provide valuable insights to help you make informed decisions about your marketing, sales, and customer support strategies.
By measuring and analyzing these metrics, small business owners can identify areas where they excel and uncover opportunities for improvement.
This post will discuss nine essential metrics to measure and optimize your customer journey.
By understanding these KPIs, you can ensure that your business is on the right track toward creating a positive, engaging, and successful customer experience.
Let’s dive into more detail about each metric!
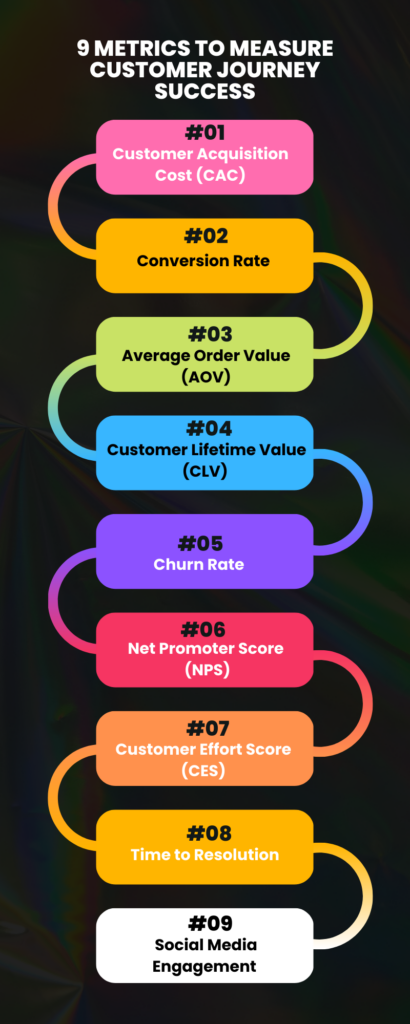
Table of Contents
Metric 1: Customer Acquisition Cost (CAC) – The Price of Winning New Customers
Customer Acquisition Cost (CAC) is a crucial metric for small business owners to monitor and understand. It represents the total cost of acquiring a new customer, including marketing, advertising, and sales expenses.
By calculating your CAC, you can determine how much you need to invest in your customer journey to attract new clients and grow your business.
Do you struggle with managing multiple social media platforms for your brand's presence?
The Sociosight app can help you simplify the process and save you time. With Sociosight, you can publish, schedule, and monitor posts and engage with your followers across multiple social media platforms, all from one dashboard.
Get started today with a free sign-up!
Register Now for Free

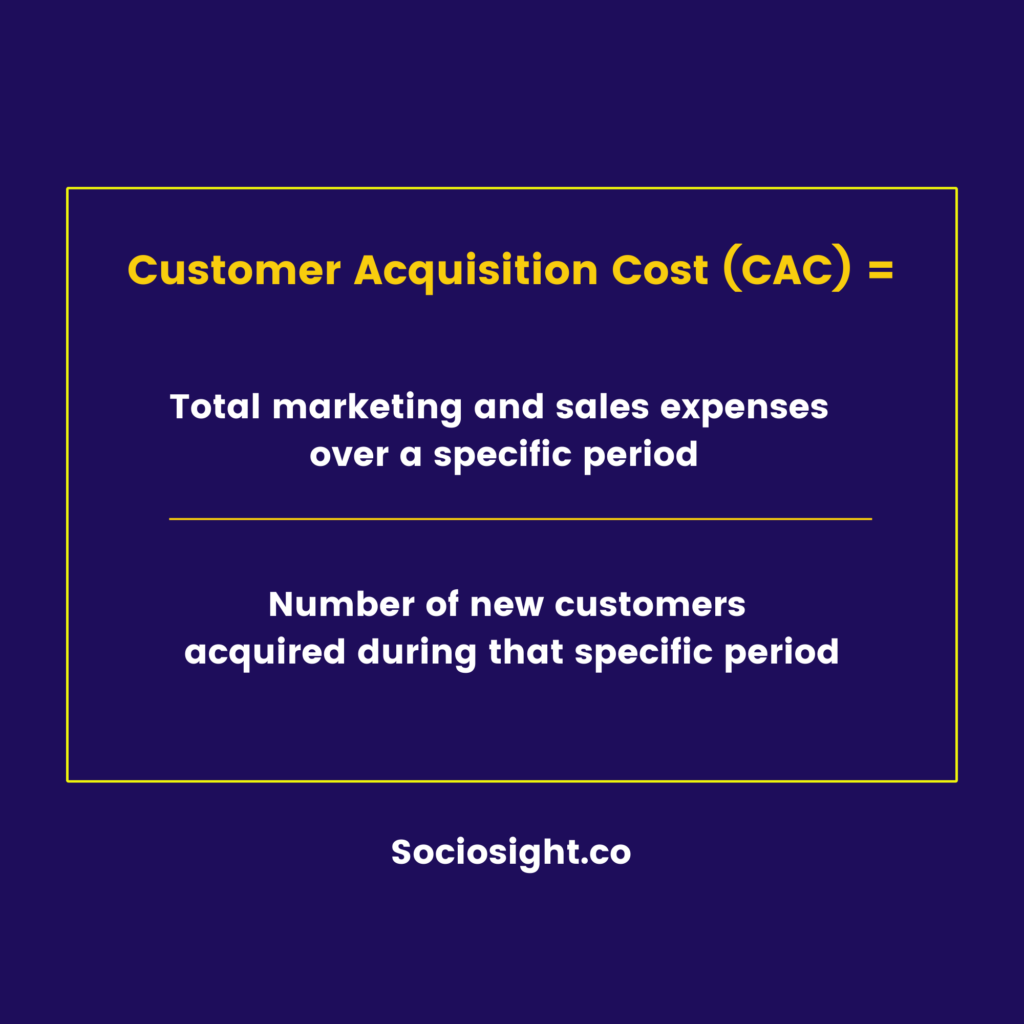
To calculate your CAC, divide your total marketing and sales expenses over a specific period by the number of new customers acquired during that time. For example, if you spent $1,000 on marketing and sales efforts and gained ten new customers in Jan 23, your CAC in that month would be $100 per customer.
Keeping track of your CAC helps you evaluate the efficiency of your marketing and sales strategies. It allows you to identify which aspects of your customer journey effectively attract new customers and which ones may require improvement.
Optimizing your customer journey can reduce your CAC and increase the return on investment for your marketing and sales initiatives.
For small business owners, it’s essential to balance spending enough to attract new customers while keeping acquisition costs manageable. Therefore, monitoring and optimizing your CAC can help you achieve this delicate balance, ensuring your business remains competitive and profitable.
Metric 2: Conversion Rate – Gauging the Effectiveness of Your Sales Funnel
Conversion Rate is a fundamental metric measuring the percentage of potential customers who complete a desired action, such as purchasing, signing up for a newsletter, or filling out a contact form.
As small business owners, monitoring conversion rates at various stages of the customer journey can provide invaluable insights into the effectiveness of the sales funnel.
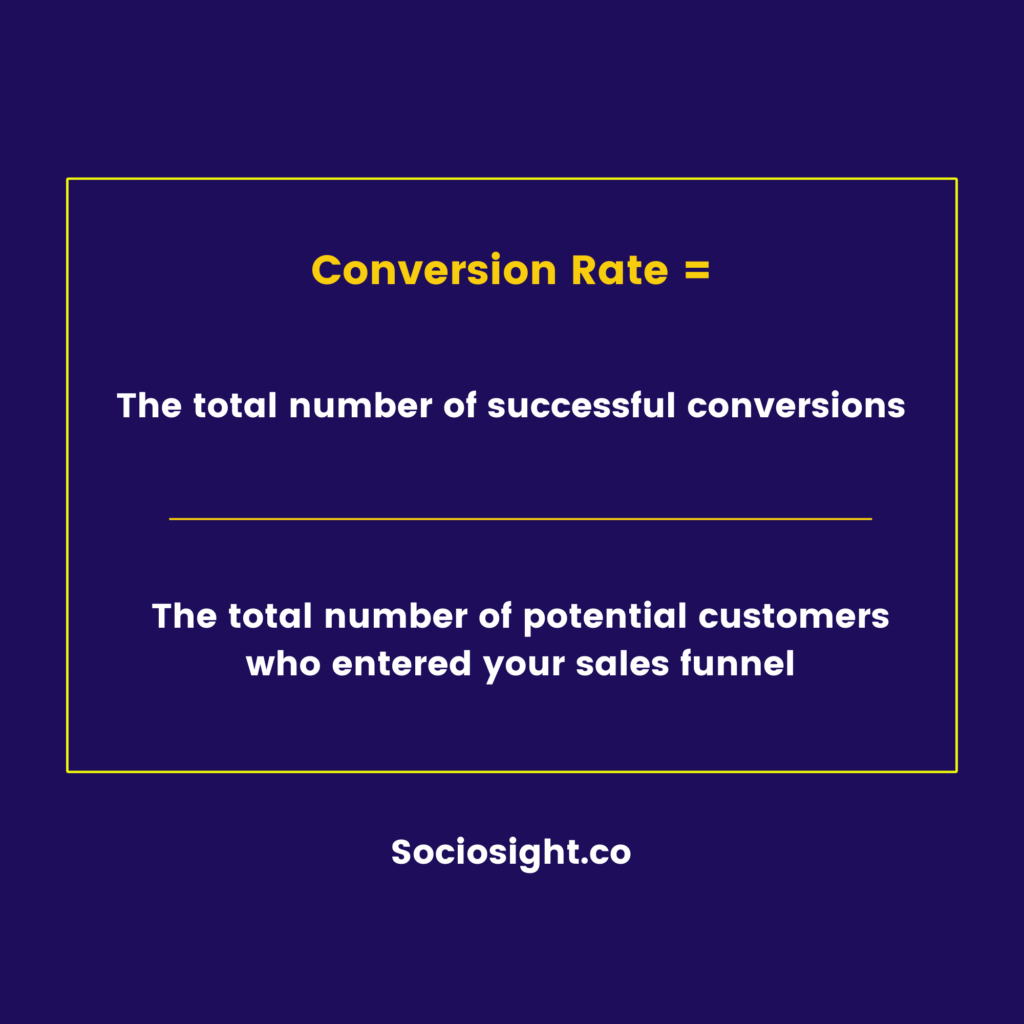
To calculate your conversion rate, divide the total number of successful conversions by the total number of potential customers who entered your sales funnel.
For example, if 50 out of 200 potential customers made a purchase, your conversion rate would be 25%.
Understanding your conversion rate helps you identify bottlenecks and areas for improvement in your customer journey.
A low conversion rate may indicate potential customers encountering obstacles or losing interest at a specific stage.
You can pinpoint these problem areas by analyzing your conversion rates and implementing targeted strategies to streamline your sales funnel and improve the overall customer experience.
As small business owners, optimizing conversion rates to maximize revenue and growth is crucial.
By continuously monitoring and refining your customer journey, you can ensure potential customers have a seamless and enjoyable experience, leading to higher conversion rates and increased profitability.
Metric 3: Average Order Value (AOV) – Assessing Customer Spending Patterns
Average Order Value (AOV) is a critical metric that helps you understand your customers’ spending patterns as a small business owner. It represents the average amount a customer spends during a transaction, providing valuable insights into customer behavior and preferences.
By monitoring your AOV, you can better understand how your customer journey influences purchasing decisions.
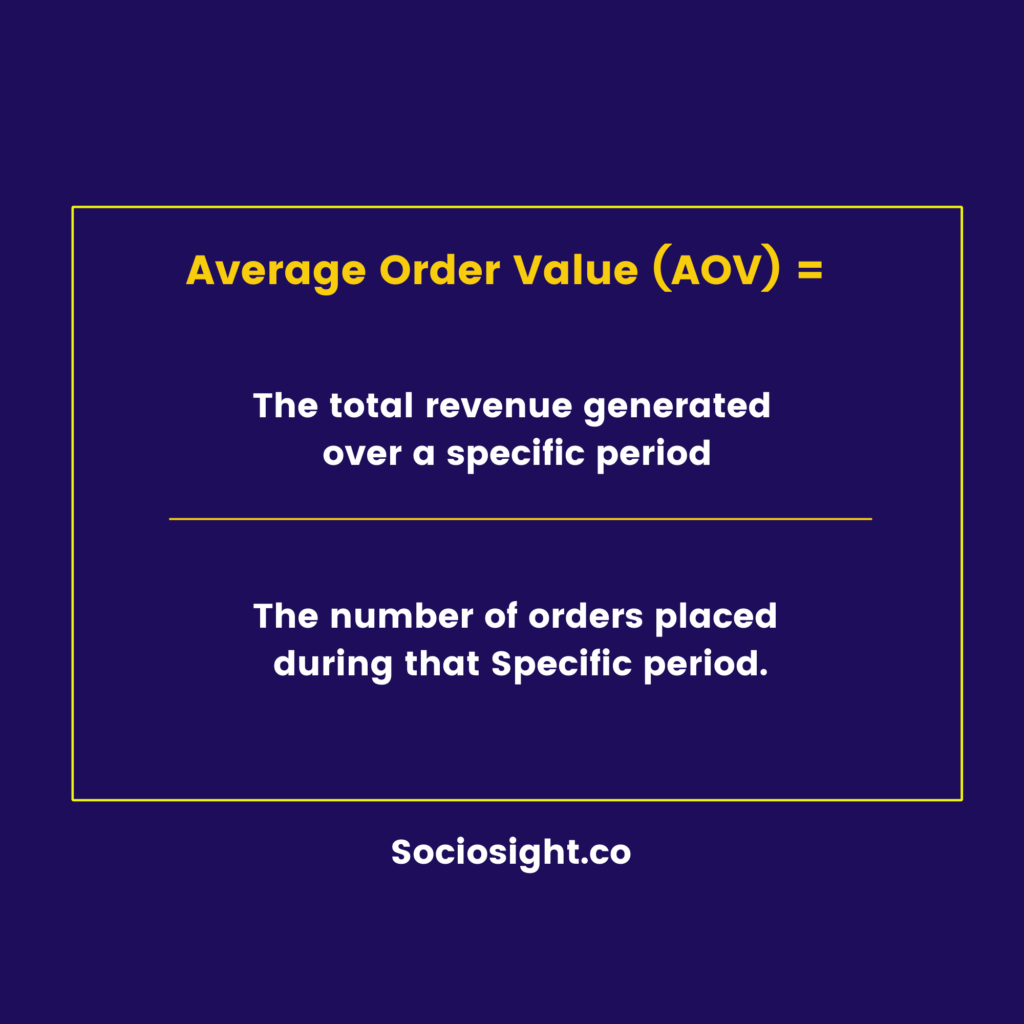
To calculate your AOV, divide the total revenue generated over a specific period by the number of orders placed during that time.
For example, if your customers spent $5,000 across 100 orders, your AOV would be $50 per order.
Tracking your AOV can help you identify opportunities to increase revenue and improve your customer journey.
If your AOV is lower than you’d like, consider implementing strategies such as upselling, cross-selling, or offering special deals and incentives to encourage customers to spend more during each transaction.
Additionally, you can analyze the customer journey to see if obstacles or pain points could hinder customers from making larger purchases.
By continuously monitoring and optimizing your AOV, you can create a more engaging and profitable customer journey. This AOV will help you maximize revenue and enhance the customer experience, leading to higher satisfaction and long-term loyalty.
Metric 4: Customer Lifetime Value (CLV) – Predicting Long-Term Revenue Potential
Customer Lifetime Value (CLV) is a critical metric that helps you, as a small business owner, estimate the total revenue a customer is likely to generate throughout their relationship with your business.
By understanding your CLV, you can make informed decisions about your marketing, sales, and customer service strategies, ensuring that you invest in the customer journey’s most valuable aspects.
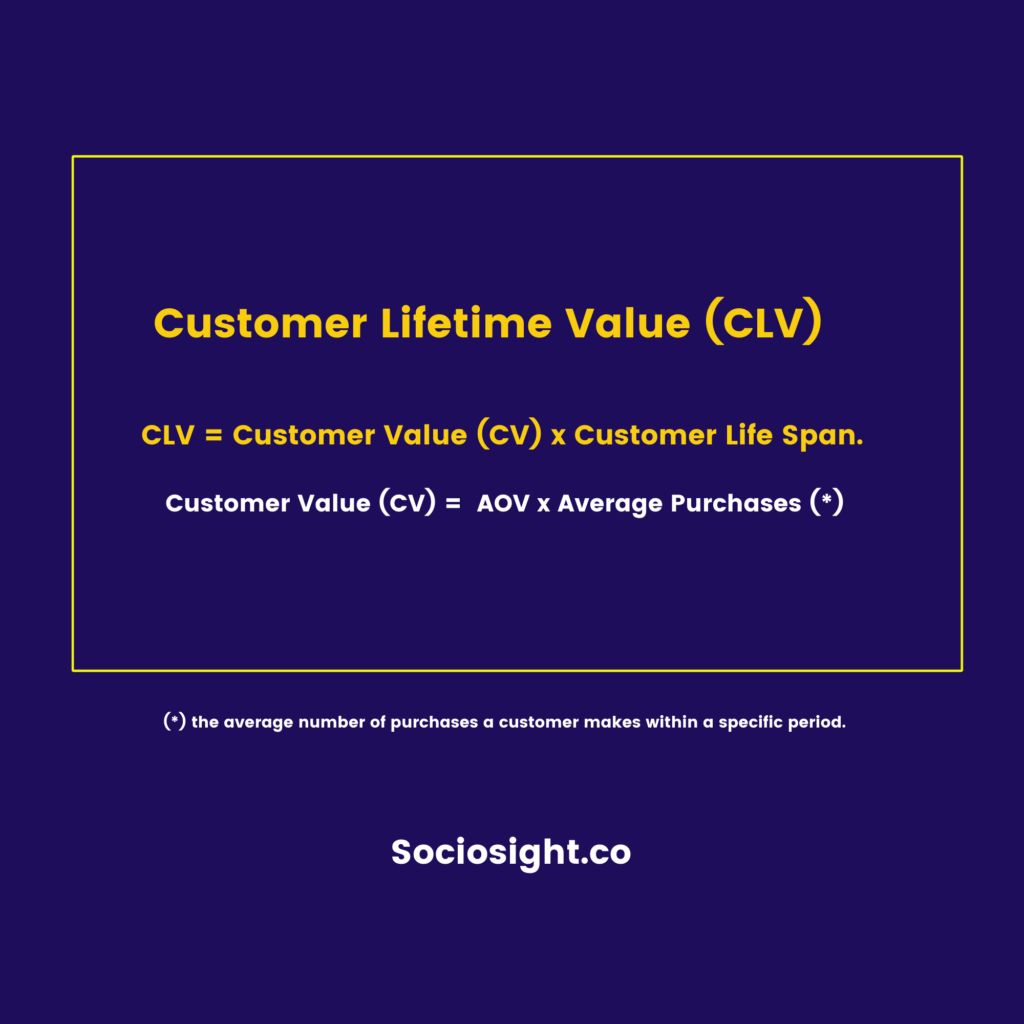
To calculate your CLV, you first need to determine the Customer Value (CV), the average order value (AOV), and the average number of purchases a customer makes within a specific time frame.
For example, if your AOV is $50 and customers make an average of 4 purchases per year, your CV would be $50 x 4 = $200.
Next, you need to estimate the average customer’s lifespan.
This customer lifespan refers to how long a customer remains engaged with your business before they stop making purchases. You can determine the average customer lifespan by analyzing your historical customer data, looking for patterns and trends in customer retention and churn rates.
Once you have calculated your CV and estimated the average customer lifespan, you can determine your CLV by multiplying the two figures. Using the previous example, if your CV is $200 and the average customer lifespan is five years, your CLV would be $200 x 5 = $1,000.
Knowing your CLV can help you identify the most effective ways to allocate resources and optimize your customer journey.
If your CLV is lower than you’d like, consider implementing strategies to boost customer retention, such as improving customer support, offering personalized experiences, or launching loyalty programs.
By enhancing the customer journey, you can increase your CLV and create a more enjoyable experience that keeps customers returning for more.
This CLV will enable you to create a customer journey that fosters solid and lasting relationships, ultimately leading to a more prosperous and sustainable business.
Metric 5: Churn Rate – Identifying Customer Retention Challenges
Churn Rate is an essential metric that allows you, as a small business owner, to measure the percentage of customers who stop doing business with your company within a specific period.
A high churn rate indicates that you are losing a significant number of customers, possibly more than you are bringing in, which often suggests issues with your customer journey.
These issues could include unmet expectations, inadequate customer service, poor product quality, or other negative aspects of the customer experience that drive customers away.
By tracking your churn rate, you can identify areas where your customer journey may need improvement, helping you retain more customers and increase overall satisfaction.
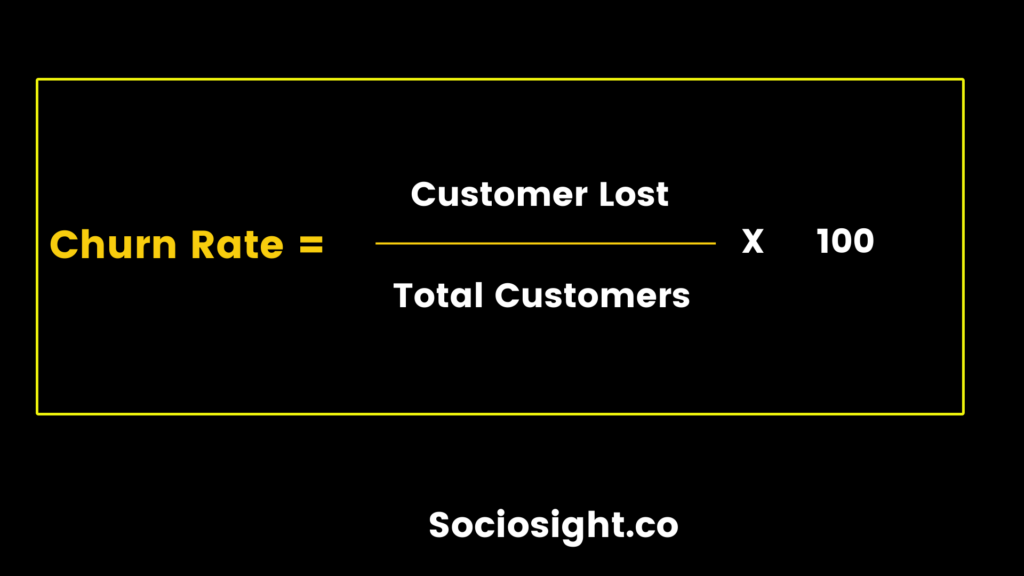
To calculate your churn rate, divide the number of customers lost during a specific time frame by the total number of customers at the beginning and any new customers acquired during the period.
For example, if you had 100 customers at the start of the month, acquired 20 new customers, and lost ten customers by the end, your churn rate would be calculated as follows:
Churn Rate = (Customers Lost / Total Customers) x 100
Churn Rate = (10 / (100 + 20)) x 100
Churn Rate = 8.33%
In this example, the churn rate would be approximately 8.33%.
Understanding your churn rate can help uncover potential customer journey issues.
If your churn rate is higher than you’d like, it’s essential to investigate the root causes and take corrective action.
You may need to refine your onboarding process, enhance customer support, or address any concerns or pain points driving customers away.
You can create a customer journey that fosters long-term relationships and loyalty by continuously monitoring and working to reduce your churn rate.
Metric 6: Net Promoter Score (NPS) – Measuring Customer Loyalty and Advocacy
Net Promoter Score (NPS) is a valuable metric that helps you measure customer loyalty and advocacy.
NPS provides insights into how likely your customers are to recommend your business to others, which can strongly indicate overall satisfaction and the effectiveness of your customer journey.
You can identify opportunities to improve customer experiences by tracking your NPS, fostering stronger relationships, and encouraging positive word-of-mouth referrals.
To calculate your NPS, you need to survey your customers and ask them a simple question:
“On a scale of 0-10, how likely are you to recommend our business [brand/company name] to a friend or colleague?” Based on their responses, customers are then classified into three categories: Detractors (0-6), Passives (7-8), and Promoters (9-10).
Your NPS is calculated by subtracting the percentage of Detractors from the percentage of Promoters:
NPS = (% of Promoters – % of Detractors) x 100
An NPS can range from -100 (all Detractors) to +100 (all Promoters).
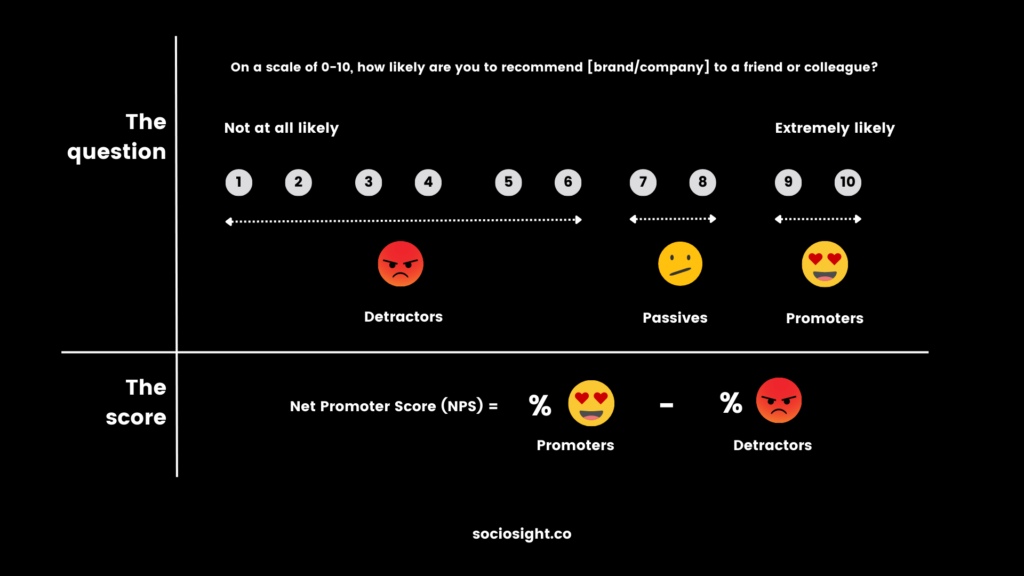
A higher NPS indicates that you have more loyal customers who are likely to recommend your business to others, while a lower NPS suggests that issues with your customer journey need to be addressed.
Monitoring your NPS allows you to gain insights into the strengths and weaknesses of your customer journey.
If your NPS is lower than you’d like, consider implementing strategies to improve customer satisfaction and loyalty, such as offering personalized experiences, enhancing customer support, or addressing any specific concerns your customers raise.
Regularly tracking and working to improve your NPS can help you create a customer journey that fosters long-term loyalty and advocacy, ultimately leading to increased growth and success for your business.
Metric 7: Customer Effort Score (CES) – Evaluating the Ease of Customer Experiences
Customer Effort Score (CES) is an important metric that helps you assess how easy it is for customers to interact with your business and resolve their issues.
By measuring the effort customers put into dealing with your company, you can gain insights into potential friction points and areas for improvement within your customer journey. Tracking your CES allows you to optimize customer experiences, leading to higher satisfaction and increased loyalty.
To calculate your CES, you need to ask your customers a straightforward question: “On a scale of 1-7, how easy was it to resolve your issue or complete your task with our business?”
A score of 1 indicates a high level of effort (very difficult), while a score of 7 represents minimal effort (effortless or very easy). Once you have collected the responses, calculate the average score to determine your overall CES.
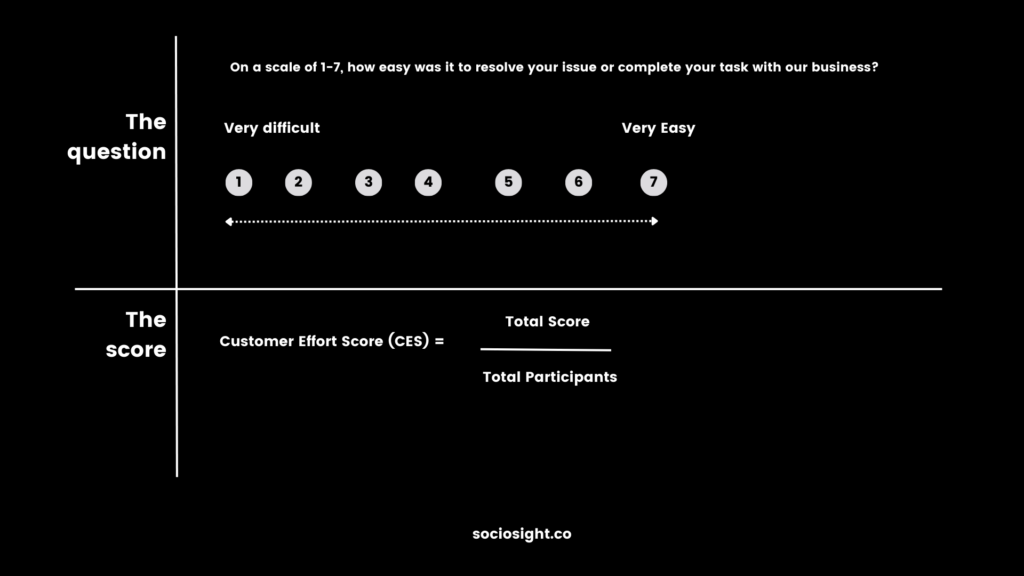
Monitoring your CES can help you identify areas of your customer journey that may require improvement, ensuring that your customers have a seamless and positive experience when interacting with your business.
If your CES is lower than you’d like, consider implementing strategies to reduce customer effort, such as streamlining processes, improving the user interface of your website or app, or offering more comprehensive self-help resources.
You can create a customer journey that prioritizes ease and efficiency by continuously tracking and working to enhance your CES.
This CES will increase customer satisfaction and help you build stronger, long-lasting relationships with your customers, contributing to your business’s overall growth and success.
Metric 8: Time to Resolution – Analyzing Customer Support Efficiency
Time to Resolution is a crucial metric that allows you to evaluate the efficiency of your customer support team in resolving customer issues.
This metric provides insights into how quickly your team can address and resolve problems, which can significantly impact the overall customer journey.
By tracking Time to Resolution, you can identify areas where your customer support process might need improvement and implement changes to enhance customer satisfaction.
To calculate Time to Resolution, measure the time it takes from when a customer first reports an issue to when it is resolved.
For example, during a week, your customer support team resolved five issues. The time taken to resolve each issue was as follows:
- Issue 1: 4 hours
- Issue 2: 6 hours
- Issue 3: 3 hours
- Issue 4: 8 hours
- Issue 5: 5 hours
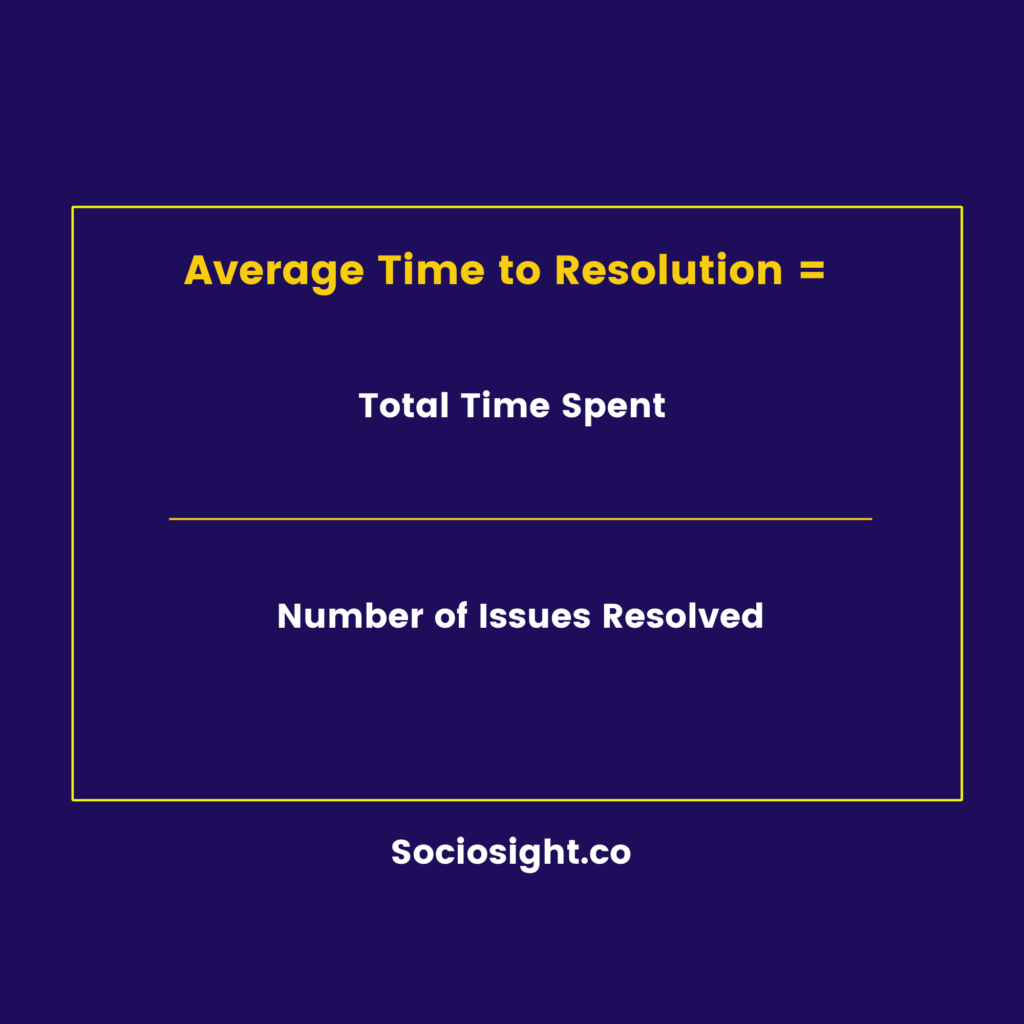
You can calculate the average Time to Resolution by adding up the total time spent resolving all issues within the week and dividing that number by the total number of issues resolved:
- Total Time Spent = 4 + 6 + 3 + 8 + 5 = 26 hours
- Average Time to Resolution = Total Time Spent / Number of Issues Resolved
- Average Time to Resolution = 26 hours / 5 issues = 5.2 hours
In this example, the average Time to Resolution is 5.2 hours. This metric can be used to benchmark your customer support performance and set improvement targets.
Monitoring Time to Resolution can uncover potential bottlenecks or inefficiencies within your customer support process that may negatively impact your customer journey.
If your average Time to Resolution is higher than you’d like, consider implementing strategies to improve customer support efficiency, such as investing in better tools, providing additional training, or streamlining support processes.
By continuously tracking and working to reduce your Time to Resolution, you can create a customer journey that addresses customer concerns more effectively and promptly. This Time to Resolution can increase customer satisfaction, stronger relationships, customer retention, and business growth.
Metric 9: Social Media Engagement – Tracking Customer Interactions and Brand Sentiment
Understanding the importance of social media engagement in the customer journey is crucial for small business owners.
Social media platforms offer unique opportunities to connect with potential customers, build brand awareness, and foster loyalty even before your target audience in marketing becomes customers.
By measuring and analyzing social media engagement, you can gain valuable insights into your target audience’s preferences and tailor your marketing efforts accordingly.
Measuring social media engagement involves tracking metrics such as likes, shares, comments, mentions, and direct messages. These metrics provide insights into how your target audience interacts with your content and how they perceive your brand, allowing you to create customer personas and tailor your content accordingly.
Content plays a significant role in keeping your audience engaged on social media.
High-quality, relevant content captivates your audience and encourages them to share, comment, and interact with your brand.
Consider implementing content batching and writing your content with any copywriting formulas to streamline your content creation process and ensure consistency. This technique involves grouping similar tasks and working on them in batches, allowing you to produce more consistent and engaging content for your audience.
Social media scheduling tools, like the Sociosight app, can be valuable in your content batching process. These tools help you plan, schedule, and automate your social media posts, ensuring a consistent presence on your chosen platforms.
Using a scheduling tool in your social media content management strategy can save time and allow you to focus on other aspects of your business while maintaining an active and engaging social media presence.
Conclusion: Turning Customer Journey Metrics into Actionable Insights
In conclusion, understanding and analyzing customer journey metrics are essential for optimizing your marketing efforts and providing a seamless customer experience. By closely monitoring these metrics and turning them into actionable insights, you can make data-driven decisions to improve various aspects of your business.
One way to leverage these insights is to refine your copywriting for website and social media content.
Using proven techniques such as AIDA copywriting and FAB copywriting, you can create compelling content that resonates with your target audience and drives them to take the desired action.
Remember that engagement is critical when measuring the success of your copywriting for social media.
Therefore, keep creating content that resonates with your audience to foster strong relationships with your audience and improve your overall customer journey.
As you implement changes based on your customer journey metrics, continually monitor your progress and adjust your strategies accordingly. This ongoing process of analysis and improvement will ensure that your business stays ahead of the competition and delivers an exceptional experience for your customers.
So, are you ready to improve your customer journey by monitoring the nine metrics explained in this post? Please share your thoughts in the comment section or DM us on our Instagram account @sociosight.co. Also, read the article that explain some customer journey examples here to give you a better idea how to implement a customer journey strategy.


